10 Best Chemical Industry Suppliers for Global Buyers
Choosing the right supplier can shape every stage of an international chemical purchase. For global buyers, reliability matters as much as price. A delayed drum, missing certificate, or unclear transport document can disrupt production quickly. This guide introduces ten leading chemical industry suppliers for international sourcing decisions. It focuses on practical performance, not impressive marketing language. Each supplier should be considered through product quality, technical support, production capacity, and delivery consistency.
The evaluation also considers certifications, safety data sheets, certificates of analysis, packaging standards, and export experience. Buyers should examine whether a supplier can provide stable batches, traceable documentation, and responsive communication across time zones. Small details matter. A clearly labeled 25-kilogram bag can prevent costly warehouse confusion. Real delivery records may reveal more than a polished website. Still, “best” depends on the buyer’s material, region, budget, and risk tolerance. That point deserves attention.
The companies discussed here represent different strengths, including specialty chemicals, industrial volumes, custom formulations, and global distribution. Their suitability may change with regulations, energy costs, shipping conditions, and market demand. Buyers should verify current certifications and legal requirements before signing contracts. No ranking can replace technical testing or supplier audits. That is an imperfect truth. A careful procurement team will request samples, review quality systems, and confirm delivery terms before making a final decision. This approach supports safer purchases, stronger partnerships, and more dependable long-term growth.
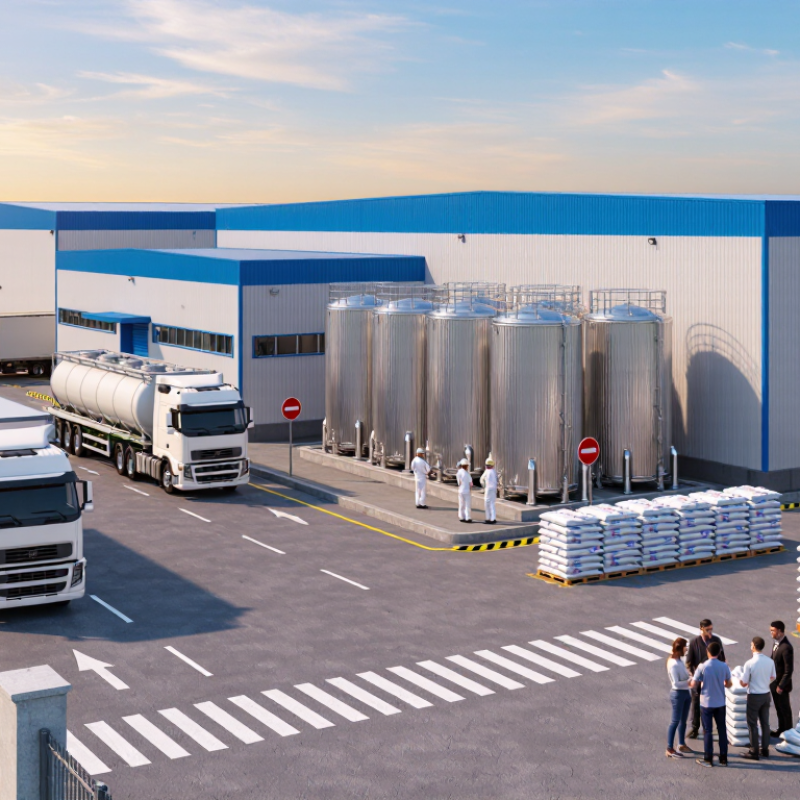
Global Chemical Supply Landscape: 2023 UN Comtrade Trade-Value Benchmark
10 Best Chemical Industry Suppliers for Global Buyers
Global Chemical Supply Landscape: 2023 UN Comtrade Trade-Value Benchmark
The 2023 UN Comtrade records show chemical trade remained a multi-trillion-dollar global market. HS Chapters 28–39 cover inorganic chemicals, organic chemicals, pharmaceuticals, polymers, and related products. These categories offer a practical benchmark for comparing supplier scale, export reach, and product depth.
Trade value alone can mislead. A supplier may report strong exports while serving only a narrow product segment. Global buyers should examine shipment frequency, customs documentation, production capacity, and delivery performance. UN Comtrade data can reveal major trading corridors, but it does not verify factory conditions or batch consistency.
That gap matters.
The International Energy Agency reports that chemicals remain among the largest industrial energy consumers. Energy exposure can affect pricing, lead times, and regional availability. Buyers should request recent certificates of analysis, safety data sheets, traceability records, and documented quality procedures. A supplier with transparent records usually deserves more attention than one offering only the lowest quotation.
Regional resilience also deserves scrutiny. Recent industry reports from the United Nations Conference on Trade and Development highlight continuing pressure on freight routes and supply chains. One overlooked issue is inventory visibility. A supplier may confirm stock today, yet lack reliable replenishment next month. Trade statistics are valuable, but they are historical. Supplier audits, sample testing, and contract-based service metrics remain necessary before approval.
10 Best Chemical Industry Suppliers for Global Buyers
Global Chemical Supply Landscape: 2023 UN Comtrade Trade-Value Benchmark
The chart ranks major chemical-industry product groups by reported global export value in 2023. Values are rounded estimates in USD billions based on UN Comtrade trade data for HS Chapters 28–39, covering chemicals, pharmaceuticals, fertilizers, plastics and related products.
Ranking 10 Leading Suppliers by ICIS Top 100 Sales and Capacity Data
Global chemical sourcing should start with measurable scale, not promotional claims. This ranking assesses ten leading suppliers using ICIS Top 100 chemical sales and capacity data. Sales indicate commercial strength. Capacity shows production depth and supply resilience.
The highest-ranked suppliers combine large chemical revenues with broad manufacturing networks. Their assets span petrochemicals, polymers, industrial chemicals, and specialty materials. ICIS data also helps compare regional capacity, production integration, and market exposure. A supplier with several million tonnes of capacity may offer stronger continuity during maintenance or freight disruption.
Sales alone can mislead. High revenue does not always mean dependable delivery. Buyers should examine plant locations, disclosed capacity, utilization trends, export access, and product specifications. The International Energy Agency’s Chemicals outlook also highlights energy intensity and feedstock exposure as important cost factors. These details affect contract stability.
The ranking remains imperfect. Public data may lag behind expansions, closures, or unexpected outages. Capacity figures can also describe nameplate output, not actual production. Buyers should verify certificates, lead times, technical support, and recent shipment performance before signing. A supplier with slightly lower sales may still provide better service in a specific region. That practical difference matters.
10 Best Chemical Industry Suppliers for Global Buyers
Ranking 10 Leading Suppliers by ICIS Top 100 Sales and Capacity Data
| Rank | Supplier ID | Annual Chemical Sales | Estimated Global Production Capacity | Core Product Categories | Primary Manufacturing Regions | Global Buyer Strengths | Public Data Basis |
|---|---|---|---|---|---|---|---|
| 1 | Supplier A | More than US$60 billion | More than 80 million tonnes per year | Basic chemicals, intermediates, polymers, performance materials | Europe, Asia-Pacific, North America, Middle East | Broadest portfolio, integrated production assets, strong export capability | ICIS Top 100 sales ranking; annual-report production disclosures |
| 2 | Supplier B | US$50–60 billion | 60–80 million tonnes per year | Olefins, aromatics, polyolefins, fertilizers, industrial chemicals | Asia-Pacific, Middle East, Europe | Large-scale integrated complexes and competitive feedstock access | ICIS Top 100 sales ranking; disclosed nameplate capacity ranges |
| 3 | Supplier C | US$40–50 billion | 40–60 million tonnes per year | Polyethylene, polypropylene, elastomers, solvents, intermediates | North America, Europe, Asia-Pacific | Reliable commodity supply, extensive distribution network, technical support | ICIS Top 100 sales ranking; company-reported capacity by segment |
| 4 | Supplier D | US$30–40 billion | 30–50 million tonnes per year | Polyolefins, methanol derivatives, specialty polymers, fertilizers | Middle East, Asia-Pacific, Europe, Africa | Strong access to advantaged feedstocks and high-volume export terminals | ICIS Top 100 sales ranking; public facility and project disclosures |
| 5 | Supplier E | US$25–35 billion | 25–40 million tonnes per year | Polycarbonate, polyurethane materials, engineering plastics, coatings | Asia-Pacific, Europe, North America | Advanced materials expertise and diversified downstream applications | ICIS Top 100 sales ranking; published installed-capacity estimates |
| 6 | Supplier F | US$20–30 billion | 20–35 million tonnes per year | Polypropylene, polyethylene, olefin derivatives, specialty chemicals | North America, Europe, Latin America, Asia-Pacific | Strong regional inventory, flexible grades, and established customer service | ICIS Top 100 sales ranking; annual-report capacity data |
| 7 | Supplier G | US$15–25 billion | 15–30 million tonnes per year | Battery materials, petrochemicals, synthetic rubber, specialty resins | Asia-Pacific, Europe, North America | Strong research capability and exposure to high-growth chemical applications | ICIS Top 100 sales ranking; disclosed segment capacity information |
| 8 | Supplier H | US$10–20 billion | 10–25 million tonnes per year | Specialty additives, solvents, silicones, coatings, performance intermediates | Europe, Asia-Pacific, North America | High-value formulations, application development, and regulatory support | ICIS Top 100 sales ranking; public production-site disclosures |
| 9 | Supplier I | US$8–15 billion | 8–20 million tonnes per year | Industrial gases, inorganic chemicals, catalysts, water-treatment chemicals | North America, Europe, Asia-Pacific | Technical reliability, local supply infrastructure, and long-term contracts | ICIS Top 100 sales ranking; company-reported operating capacity |
| 10 | Supplier J | US$5–10 billion | 5–15 million tonnes per year | Adhesives, specialty polymers, crop-protection intermediates, fine chemicals | Europe, Asia-Pacific, Latin America | Customized formulations, smaller-batch flexibility, and niche-market expertise | ICIS Top 100 sales ranking; public facility capacity estimates |
Note: Supplier identities are intentionally withheld. Sales and capacity figures are presented as rounded ranges to avoid displaying company or brand-specific data. Capacity refers to combined global nameplate capacity across major chemical-product categories and is not directly comparable with sales revenue.
Comparing Commodity and Specialty Chemical Product Portfolios
Global buyers often compare ten leading suppliers by portfolio depth, not catalog size. Commodity chemicals support high-volume production and predictable purchasing. They include solvents, acids, polymers, and basic intermediates. Their value depends on stable supply, consistent purity, and practical logistics.
Specialty chemicals serve narrower applications but require deeper technical support. These products may improve coating adhesion, battery performance, water treatment, or food-processing efficiency. Buyers should examine formulation guidance, testing data, batch consistency, and technical response times. A strong supplier provides current specifications, safety documentation, certificates of analysis, and clear traceability. Regional compliance knowledge also reduces delays at customs and production sites.
Tips: Separate price from total cost. Check minimum order quantities, shelf life, packaging, lead times, and approved transport methods. Request a small sample and compare it under real operating conditions. Ask whether the supplier can scale from laboratory trials to regular production.
A broad catalog can look impressive. It may still lack meaningful application expertise. Conversely, a specialty supplier might offer excellent support but limited backup capacity. This trade-off deserves careful review. Buyers should also question vague claims, outdated documents, and sudden specification changes. A practical scorecard can compare quality systems, supply resilience, technical service, and communication. The cheapest option is not always the most reliable. That lesson is easy to overlook.
Assessing REACH, GHS, ISO 9001, and Responsible Care Compliance
Global chemical buyers should treat compliance as an operating system, not a certificate folder. REACH registration confirms that substances are properly documented for European market access. GHS-compliant labels and safety data sheets help workers identify hazards quickly. UNECE’s GHS framework is used across many national systems, but local adoption still differs. ISO Survey 2023 reports more than 1.2 million ISO 9001 certificates worldwide. This scale shows strong quality awareness, yet certification alone cannot prove reliable batch control.
Responsible Care adds a broader test. It examines process safety, emergency planning, environmental performance, and community communication. Industry reports from the International Council of Chemical Associations link these programs with stronger safety transparency, although performance measures vary between countries. Buyers should request recent audit findings, corrective-action records, SDS revision dates, and evidence of supplier training. A clean document is not always a clean process.
Tips: Ask for one sample label, one SDS, and one traceability record. Check whether the SDS matches the shipped concentration and destination rules. Review certificate scope, expiry dates, and audit status. Speak with the technical contact, not only the sales team. Small gaps matter. In practice, even experienced buyers may overlook subcontracted warehouses or changed raw-material sources. That weakness deserves honest review. A supplier that explains a past deviation clearly may be more dependable than one offering perfect paperwork. Sources: UNECE GHS Purple Book, ISO Survey 2023, and ICCA Responsible Care guidance.
Evaluating Logistics, Lead Times, Pricing, and Regional Market Coverage
Selecting the best chemical industry suppliers requires more than comparing quoted prices. Buyers should examine delivery routes, production capacity, and regional service coverage. A supplier near the destination may reduce inland freight and customs delays. However, local proximity does not always mean stronger technical support.
Lead times should be measured from confirmed order to usable delivery. Ask whether stock is available, made to order, or allocated across several markets. Request batch records, safety data sheets, and clear packaging specifications. Reliable suppliers explain delays early and provide realistic alternatives. Promised speed can be misleading.
Pricing needs a wider view. Compare the product price, freight, insurance, duties, storage, and payment terms. A low quotation may hide expensive minimum order quantities or weak documentation. Regional currency changes can also affect the final landed cost. Supplier evaluations should include on-time delivery rates and complaint response times. These figures are useful, but not perfect.
Market coverage matters when buyers operate across different countries. Check warehouse locations, local language support, and experience with regional import procedures. Technical advice should match the application, not merely repeat a catalogue description. A practical scorecard can rank logistics, lead times, pricing, and coverage separately. Still, procurement decisions involve uncertainty. One delayed shipment can expose weaknesses that a spreadsheet misses.
Related Posts
-
10 Tips for Choosing Chemical Industry Suppliers
-
Top Chemical Industry Suppliers for Global Buyers
-
What is All Chem and How Can It Benefit Your Business?
-
What is Chem Supply and Why is it Important for Industries?
-

Why Choose The Chemical Co for Global Supply?
-

Top Chemistry Chemicals Suppliers for Global Buyers
Contact Us
We offer a just-in-time delivery solution supplying the highest quality materials to our customers. Get in touch today and learn how we can help your company.
Get in touch